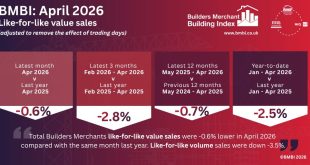
The latest Builders Merchant Building Index (BMBI) report, published by MRA Research, shows April’s total like-for-like value sales, adjusted to remove the effect of trading days, were -0.6% lower than the same month in 2025. With no difference in trading days, total unadjusted value sales were also -0.6% lower, with …
Read More »April sales drift down in BMBI report